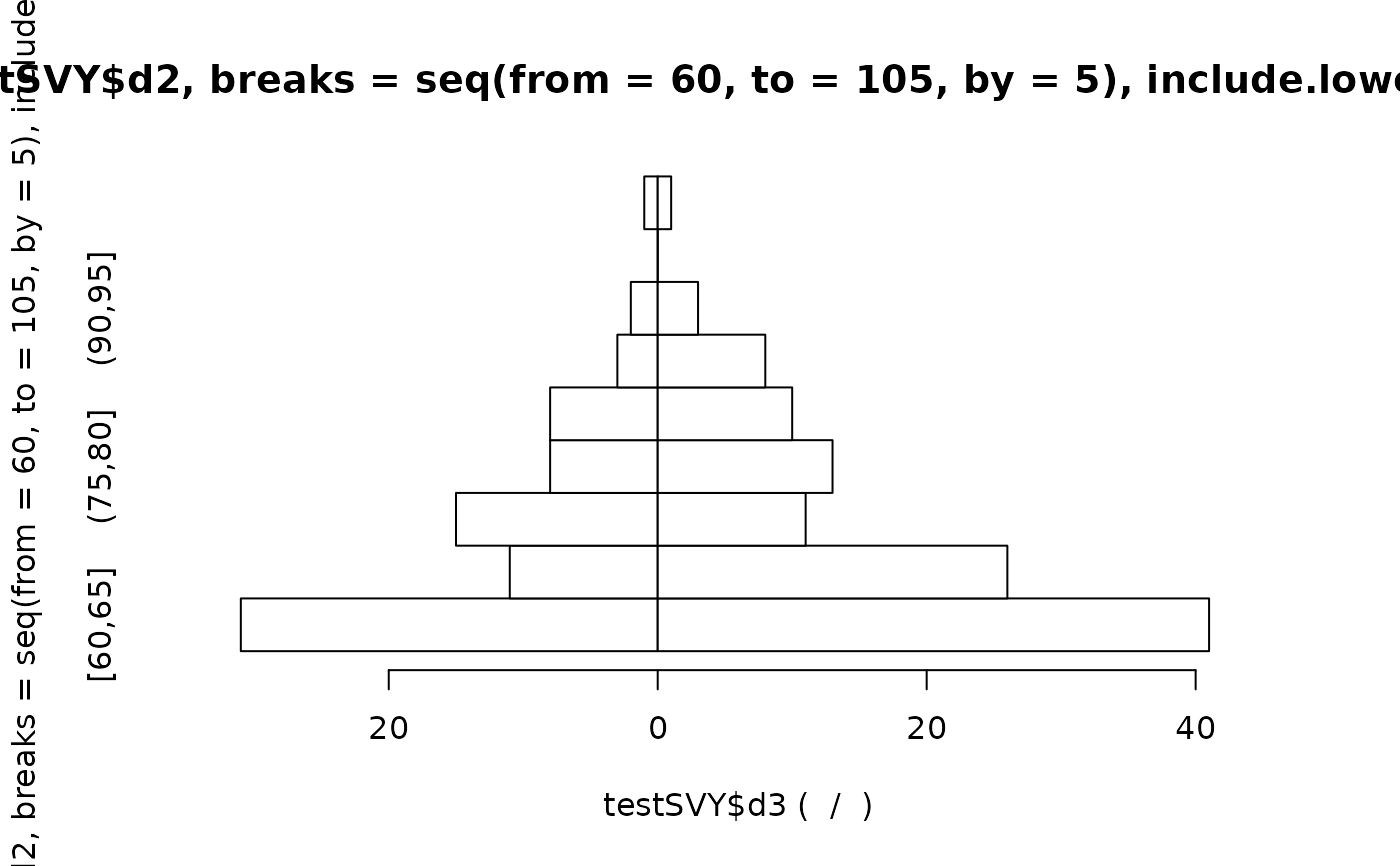
Function to create a pyramid plot
Usage
pyramid_plot(
  x,
  g,
  main = paste("Pyramid plot of", deparse(substitute(x)), "by", deparse(substitute(g))),
  xlab = paste(deparse(substitute(g)), "(", levels(g)[1], "/", levels(g)[2], ")"),
  ylab = deparse(substitute(x))
)
Arguments
- x
A vector (numeric, factor, character) holding age-groups
- g
A binary categorical variable (usually sex)
- main
Plot title
- xlab
x-axis label
- ylab
y-axis label
Examples
pyramid_plot(
  x = cut(
    testSVY$d2,
    breaks = seq(from = 60, to = 105, by = 5),
    include.lowest = TRUE
  ),
  g = testSVY$d3
)


